Tokyo Takedown
The Tokyo Housing Supply Story Unpacked

Tokyo Takedown: The Tokyo Housing Supply Story Unpacked

Tokyo is frequently held up as an example of land use planning leading to improved housing affordability. Within YIMBY circles, Tokyo functions as the proof of concept for liberalized zoning unlocking housing abundance. To take one example, Scott Beyer’s piece in the Market Urbanism Report “Tokyo's Affordable Housing Strategy: Build, Build, Build”, lays out the main canons of this argument. This same story has been aired in a range of liberal to libertarian outlets, including Sightline, Brookings, Wall Street Journal, Vox, Mises Institute, and Reason Magazine.
Proponents of zoning and land use deregulation note that Japan moved to a simplified, nationally set zoning system in 2002 with the Urban Renaissance Act, and argue that this led to an increase in housing construction. This building boom is also posited to have kept housing and rent costs within Tokyo flat, even as the city’s population continued to grow.

This seems like a compelling story, but I’m not sure if it holds up on closer inspection. First of all, the argument rests on the idea that the reduction in housing price growth is caused by loosened land use regulation, leading to expanded supply. Let’s take a look at trends in housing construction over the past 40 years.
Here is the total dwelling stock in Tokyo Prefecture between 1963-2013:

Growth has been fairly consistent over time. What we do not see is a massive spike in residential construction following reforms to zoning in the later 20th century. Similarly, across Japan as a whole there has been a steady addition of new housing, at a rate of roughly 3 million new units every 5 years:
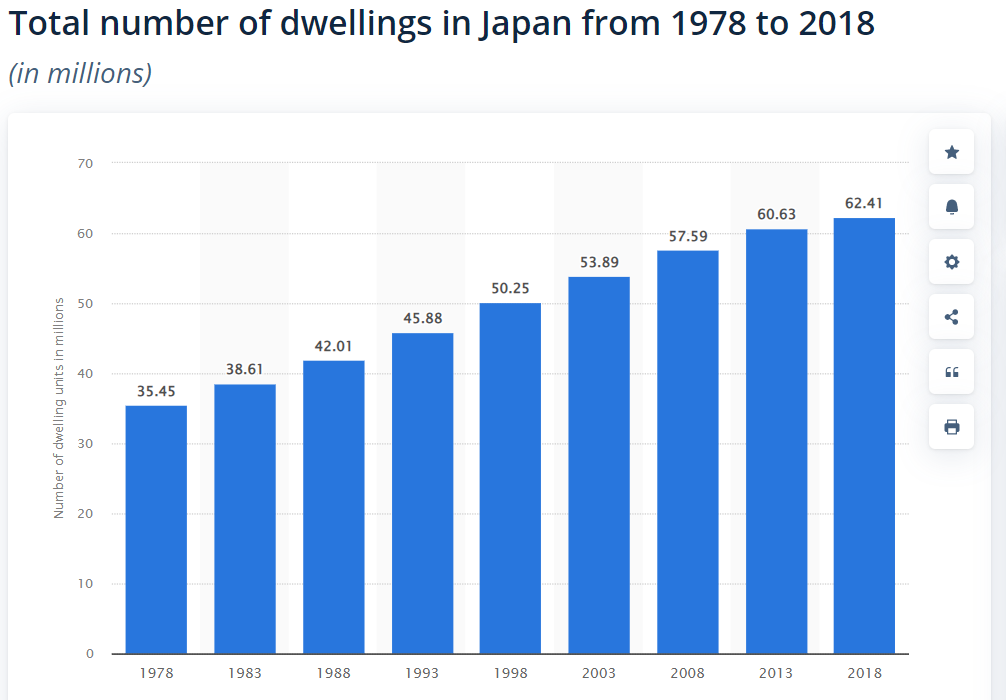
In fact, the annual growth in housing stock has actually decreased following the land use reforms, although it maintains relatively strong growth.

Was Japan always a paradise for liberal zoning? If that’s the case, its housing policy clearly wasn’t effective in preventing the enormous real estate bubble which resulted in the highest land prices in the world at one point.

Land values rose throughout the 70s, and shot up dramatically during the 80s. Famously, at one point Tokyo’s Imperial Palace was worth more than the entire state of California. This period coincided with a steady addition of new housing, which in theory would ease pressures and keep prices stable. However, rent prices steadily increased from 1970 onward, until the housing bubble burst in 1992.
Changes in the Prices of House Rent in Japan, 1970-2014:

The flat trend in land values and rent prices can be most directly explained by the burst of the bubble, and subsequent economic stagnation, rather than the zoning codes.
The economic history of Japan is unique. A speculation-fueled real estate bubble in the late 80s, led to a collapse in 1992 and resulted in a “Lost Decade” throughout the 90s. Although this lost decade formally ended in 2003, its effects have continued to linger over the past 3 decades. One of the key impacts has been deflation. While many countries have struggled with inflation, Japan has faced a stagnating economy due to the opposite. This means that overall, its Consumer Price Index (CPI) has stayed flat, holding down the price not just of housing but most consumer goods as well. Along the same lines, Japan has seen very limited wage growth over the past few decades. Wages in Japan are almost exactly what they were in 1990, while other OECD countries have seen more growth. With rents being linked to local incomes, it's not surprising that housing costs have remained relatively modest as well.
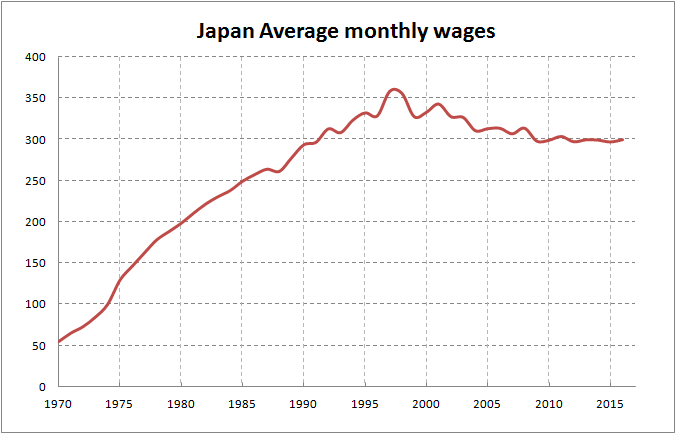
The figure shows a clear trend - wages increased in Japan as the economy grew quickly throughout the 70s and 80s. However, following the real estate crash wages faltered, and then stagnated since the mid-90s.
A broadly similar trend can be observed in the average new apartment prices in Greater Tokyo as well as nationwide. This suggests that the flat growth in wages and house prices are either linked to each other, or caused by a separate underlying factor. It seems plausible that both metrics are affected by the fairly unique overall economic conditions in Japan since the 1990s.

Given these economic factors, how can we best make a fair comparison? The most direct way is to compare median apartment prices to median incomes. According to Tokyo Kantei, a Tokyo-based real estate market research firm, Japan’s nationwide 2019 income multiple for a newly constructed apartment is 8.19 - with Tokyo having a median multiple of 13.26. For comparison, here are some large US cities’ price-to-income ratios:
Portland, OR: 7.5
Washington, DC: 7.6
New York, NY: 10.5
San Francisco, CA: 12.3
Data varies on this measurement and can be difficult to define objectively. One major study, the Demographia International Housing Affordability Survey (IHAS), is commonly cited because it provides a seemingly comprehensive international comparison. According to Demogaphia’s 2017 survey, Tokyo has a median multiple of 4.7, ranking it among the more affordable major cities, although still falling under the category of “seriously unaffordable”. However, it must be noted that IHAS has received substantial criticism for its methods and biases. One article in Transport Research International Documentation stated that “The IHAS fails to reflect professional standards: its analysis methods do not reflect current best practices, is not transparent, misrepresents key research, fails to respond to legitimate criticism, and lacks peer review. This critique indicates that the IHAS is propaganda, intended to support a political agenda rather than provide objective guidance. Although the IHAS information may be useful, it is important that users understand its biases.” An additional critique, “Demographia housing affordability surveys: an assessment of the methodology”, notes that “The Demographia surveys are based on a single indicator of housing affordability - the median multiple for housing purchase, which excludes rental dwellings which are important sources of affordable housing supply; includes all home buyers and all house prices across an entire city, ignoring the presence of discrete housing markets across a city that may be much more affordable than the single median multiple suggests; and excludes the impact of interest rates, which dramatically influence affordability for individual households. More precise measures of housing affordability focus on the number of households in the bottom two income quintiles paying more than 30 percent of their income in housing costs.”
In many ways, the methodology of housing affordability used by IHAS does not tell the full story. In addition to the issues highlighted above, it fails to account for the size of housing units. The importance of this metric could be a matter of debate. When you pay for housing, are you paying for a unit, or for a certain quantity of housing (area of living space)? To be fair, there’s no question that a homeless person would prefer to have a roof over their head, even in a very small home, rather than live on the street. But when asserting claims about the impact of planning rules on housing prices as a whole, I do think it’s reasonable to look at the quantity of housing consumed for a given amount of money.
Under this method of comparison, Tokyo does not stand out as exceptional. For a given value of money, you’re not getting much living space in Tokyo. On average, apartments in Tokyo tend to be much smaller than in comparable cities.

Some apartments in Tokyo are extremely small, such as the 76,000 apartments that are only 9.8 sqm in size.

How does affordability stack up in relation to dwelling size? In other words - how much of the average income does living space consume per square meter?
By this metric, it’s actually pretty dire for Tokyo. Tokyo comes out as less affordable per square meter relative to the average income than New York City, Los Angeles, and San Francisco. From numbeo.com, here is the average price per square foot to buy an apartment in San Francisco, along with the average monthly net salary:

And here are those same statistics for Tokyo:

In Tokyo, the percentage of median monthly salary to buy one square foot of apartment space is 31%. In San Francisco, the equivalent figure is 15.23%. Yes, according to this estimate, Tokyo is actually twice as expensive as San Francisco on a per square foot basis in relation to average salaries!
So to sum it up, market urbanists have elevated Tokyo as an example of relaxed land use regulations unleashing the power of the free market to provide abundant, affordable housing even in a major, growing city. This story ignores the actual data and fails to consider the unique characteristics of the Japanese economy which makes uncritical comparisons with US cities bizarre. With a stagnant, deflationary economy, decades of flat wages, and small apartment sizes, Tokyo can hardly be held up as an abundant housing utopia.
Japan offers some interesting lessons on housing and land use policy, but extrapolations should be taken with a grain of salt. Focusing purely on the absolute price of housing doesn’t tell you how expensive it is for actual residents relative to average income. And as with any policy, one must situate it in a broader economic and political context. In the case of Tokyo, the background of several decades of economic stagnation makes these comparisons with the US less informative. Flatlining housing prices can be more accurately considered a symptom of overall economic conditions than a success of Japanese urban policy.
US cities may want to emulate Japanese density and transit-oriented development, but we shouldn’t expect this on its own to lead to housing affordability. We need strong investment in social housing, tenant protections, and housing subsidies to guarantee a right to housing. The example of Tokyo should not be distorted to argue against the robust non-market provision of housing.
"The example of Tokyo should not be distorted to argue against the robust non-market provision of housing."
Has anyone used Tokyo to further that argument? I'm pretty familiar with the "YIMBY circles" you reference and all the major groups and people I know of want far more subsidized, non-market housing. They want all sorts of more housing, not just one particular type.
We essentially have two housing crises - one where people in poverty can't afford housing (i.e., our enormous homeless population) and one where even families bringing in decent incomes struggle to find housing in their budget. The YIMBY movement wants to tackle both crises and there are differing solutions for both, but both involve more housing (market and non-market).
Japan has lower median wages than the USA, but they have far less rates of homelessness than us. And if you zero in on American cities, it's often ones with lower poverty and unemployment rates (SF, Seattle, LA, NYC) but far more restrictive housing regulations that have higher homelessness than places with higher poverty rates. I think America could learn from Japan's example on housing that we should both have a more generous welfare state and repeal exclusionary zoning that exacerbates homelessness.
I think with Tokyo you also just have to appreciate how eco-friendly it is compared to US cities. Utilizing density and mass transit/walkability the way Tokyo does yields enormous environmental advantages and super low carbon-footprints. That alone is a great reason to emulate it. And it's not like it comes at a cultural or economic cost, like it's some gloomy Soviet urbanization - it's the arguably the most dynamic and exciting place on Earth - the biggest metropolitan area the world has ever seen! And the difficulty in getting prices affordable show how desirable it is that people want to live there.
"In Tokyo, the percentage of median monthly salary to buy one square foot of apartment space is 31%. In San Francisco, the equivalent figure is 15.23%. Yes, according to this estimate, Tokyo is actually twice as expensive as San Francisco on a per square foot basis in relation to average salaries! "
this feels weird. SF's salaries are much, much higher. ~8k a month, median. Tokyos is ~3k a month. We need to be looking at demand as well. how much housing stock is there? how much demand is there? looking at these bare percentages alone at the surface level doesn't tell much. kinda feels like a self-serving argument.